Compare:
AI-Powered Supply Planning
Overview
My Role
UX Design Intern working with the Supply Chain Management (SCM) Design Team, leading the end-to-end design of Compare from research to high-fidelity prototypes
Project Timeline
June 2025 – September 2025
The Challenge
Supply planners at Oracle manage tens of thousands of components daily, spending 5-6 hours in manual, error-prone processes. They lack an efficient way to compare alternative supply plans and understand critical differences - forcing them to export data to Excel just to see what changed.
The Solution
Compare: an AI-powered tool that surfaces critical differences between supply plan scenarios, uncovers hidden risks and ripple effects, and provides guided recommendations - transforming AI from automation into a collaborative colleague.
The Impact
Recognized by Oracle leadership as "next-level visionary" and positioned as a reference point for future AI-collaboration tools across the enterprise.

Research Approach
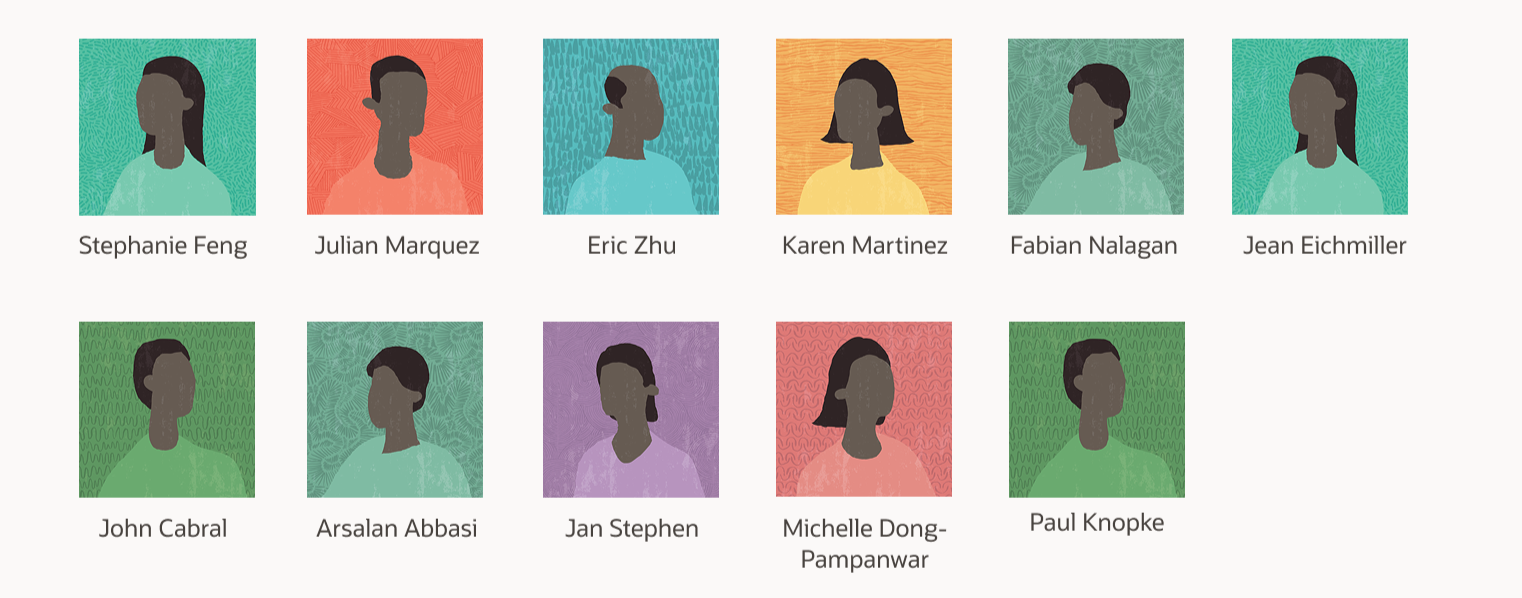
To ground my design in real user needs, I conducted 11 in-depth interviews with Oracle supply and demand planners. These conversations revealed the complexity, frustration, and expertise that define their daily work.
UNDERSTANDING THE PROBLEM
Meet Amy
A Supply Planner
Amy manages over 100 unique parts for high-performance cordless power drills used by contractors and consumers, such as motors, battery packs, chargers, drill bits.
She works on a 2-year planning horizon across multiple global manufacturing sites.
Her Primary Goal: Create reliable supply plans that meet customer demand, ensuring products are delivered on time to meet customer expectations and business goals.
Just like a designer creates wireframes that anticipate user needs, a supply planner creates supply plans that anticipate customer demand.
Her Secondary Goals
Compare alternative supply plans and their outcomes to choose the best path forward
Understand the most important changes and risks to make confident, timely decisions
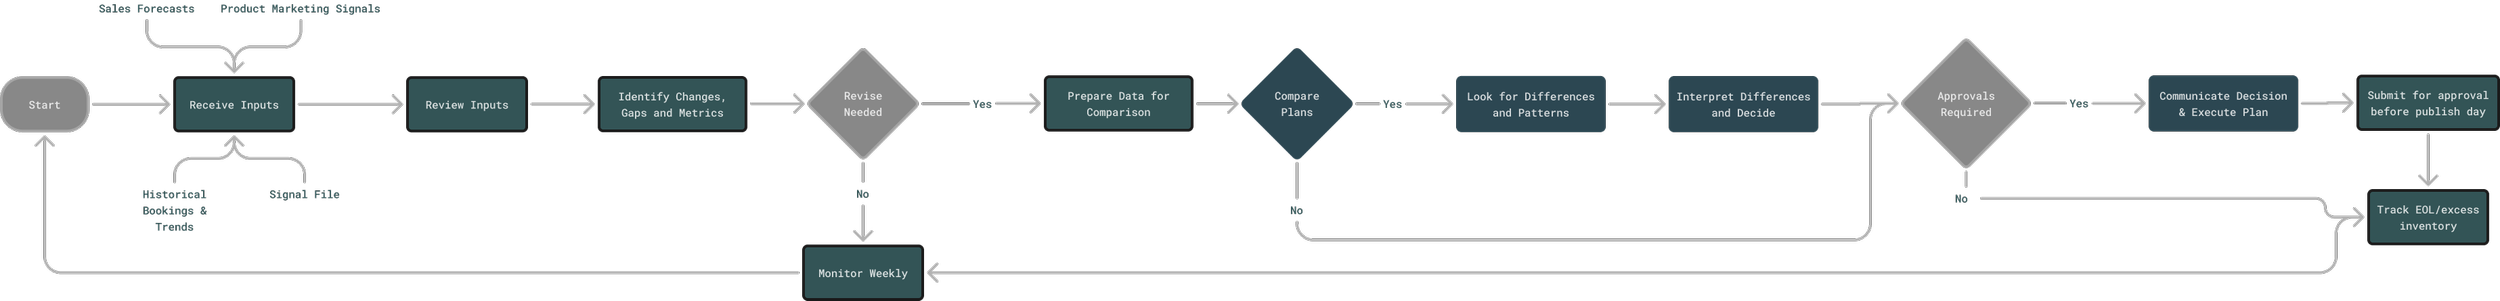
Supply Planner User Flow
Manual, Error-Prone Processes
Planning work is repetitive and risky. To compare different plans, planners must export data from Demand Management and import it into Excel - the only space where they can actually compare.
“I copy and paste from Excel into Demand Management and sometimes it doesn’t even go in correctly.”
Through my interviews, three critical pain points emerged:
PAIN POINT #1
DEFINING THE PROBLEM
Information Overload Without Clarity
Planners aren't overwhelmed because they can't handle complexity - they're excellent at what they do. But even in Excel, where they can see differences, they have to scroll through massive spreadsheets to get the full picture of a single plan comparison.
“I need to understand what’s being tested before l even try to visualize anything... it’s hard to see what’s going to be impacted
and how.”
PAIN POINT #2
No Easy Way to Run Scenarios
There's no straightforward way to test different approaches, which makes it hard to evaluate risks or adapt plans with confidence.
“We do the best we can... it’s just very manual and very painful. We don’t have tools to test things. Everything is just a best guess in Excel.”
PAIN POINT #3
The Scale of Complexity
A single plan contains 1,000 to 100,000 components (typically around 10,000)
Planners manage 1 to 8 plans simultaneously
They spend 5 to 6 hours daily deep in planning work
They work on 2-year planning horizons with 8 quarters of forecasting
How Might We?
Based on these insights, I reframed the design challenge:
How might we reduce cognitive load so planners can focus on decisions, not data processing?
How might we surface the most critical differences automatically so planners don't miss important changes?
How might we make scenario planning fast and accessible so planners can evaluate options confidently?
How might we leverage AI to enhance planner expertise rather than replace their judgment?
How might we build trust in AI recommendations through transparency about what changed and why?
Simple
Reduce complexity so planners can focus on decisions, not navigation.
DESIGN PRINCIPLES
Transparent
Show exactly what changed and why, building trust in system recommendations.
Guided
Provide clear next steps and context, helping planners act with confidence.
I explored different models for how AI could fit into the planning workflow:
On one end: Fully automated: AI makes all decisions, removing planner control
Current state: Mostly manual: planners do everything themselves with basic AI tools
My approach: AI as collaborative colleague: positioned in the middle
In this model:
AI performs deep data analysis, compares plans, and suggests optimizations
AI explains its reasoning transparently
Planners review, adjust, and make final decisions
This respects planner expertise while dramatically reducing manual burden.

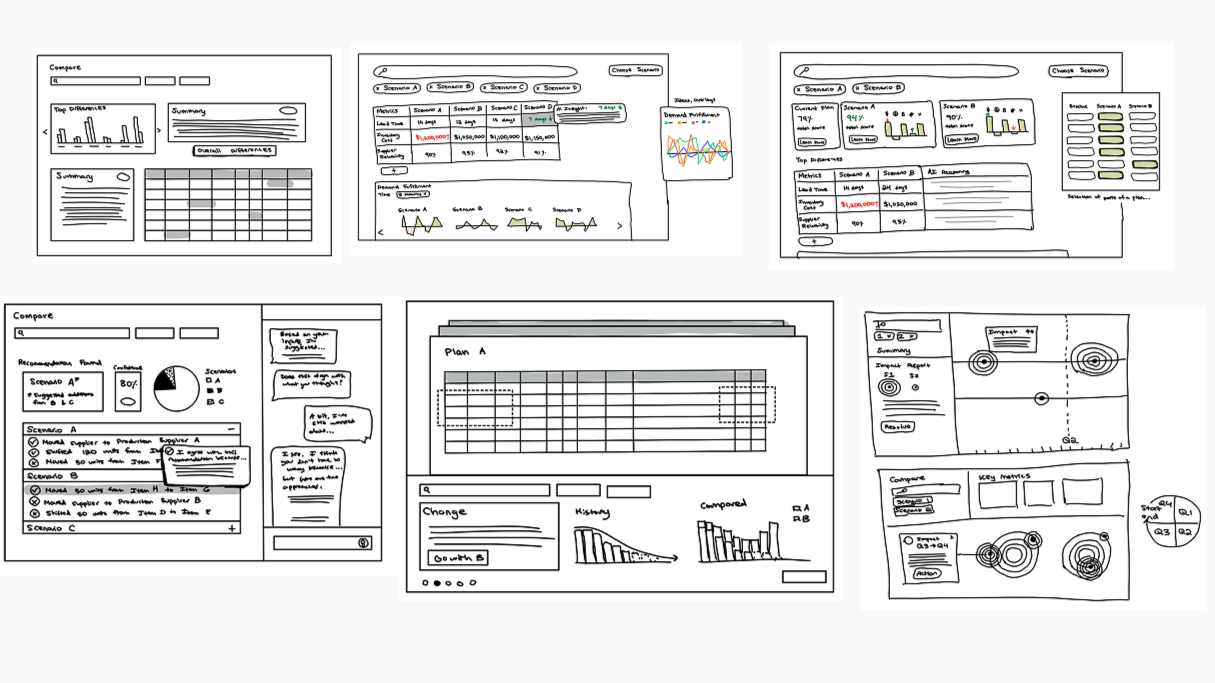
IDEATION
I started with sketching sessions, exploring different ways planners might compare plans and navigate critical information. Through iteration and feedback from 10 design reviews, several key decisions emerged:
Decision 1: Side-by-Side Comparison with Grading
Rationale: Planners need to quickly scan multiple scenarios while understanding relative quality. A grading system provides immediate context.
Decision 2: Editable Weights for Prioritization
Rationale: Different scenarios require different priorities. Amy might deprioritize quality risk in one situation but prioritize it when working with a new supplier. The system should adapt to context.
Decision 3: Inline Preview of AI Suggestions
Rationale: Planners won't trust black-box recommendations. They need to see the "why" and "what happens next" before committing to changes.
Decision 4: Template-Based Visualizations
Rationale: Instead of forcing planners to build their own views from scratch, Compare anticipates what they need based on the type of change - pulling from a template library to save time and reduce cognitive load.
The Solution
Compare helps supply planners quickly find the most important differences between their plans, with AI uncovering risks, ripple effects, and recommending targeted actions.
A Real Scenario
Amy receives an urgent request from Home Depot: a 15% demand increase for premium cordless drills—that's 1,500 more units, needed by end of Q3 instead of mid-Q4.
To meet this acceleration, Amy must quickly assess whether her suppliers can deliver hundreds of additional components ahead of schedule. If she can't rebalance or expedite in time, it could delay launches and cost millions in lost sales.
Amy decides to test three different scenarios overnight and compare them in the morning.
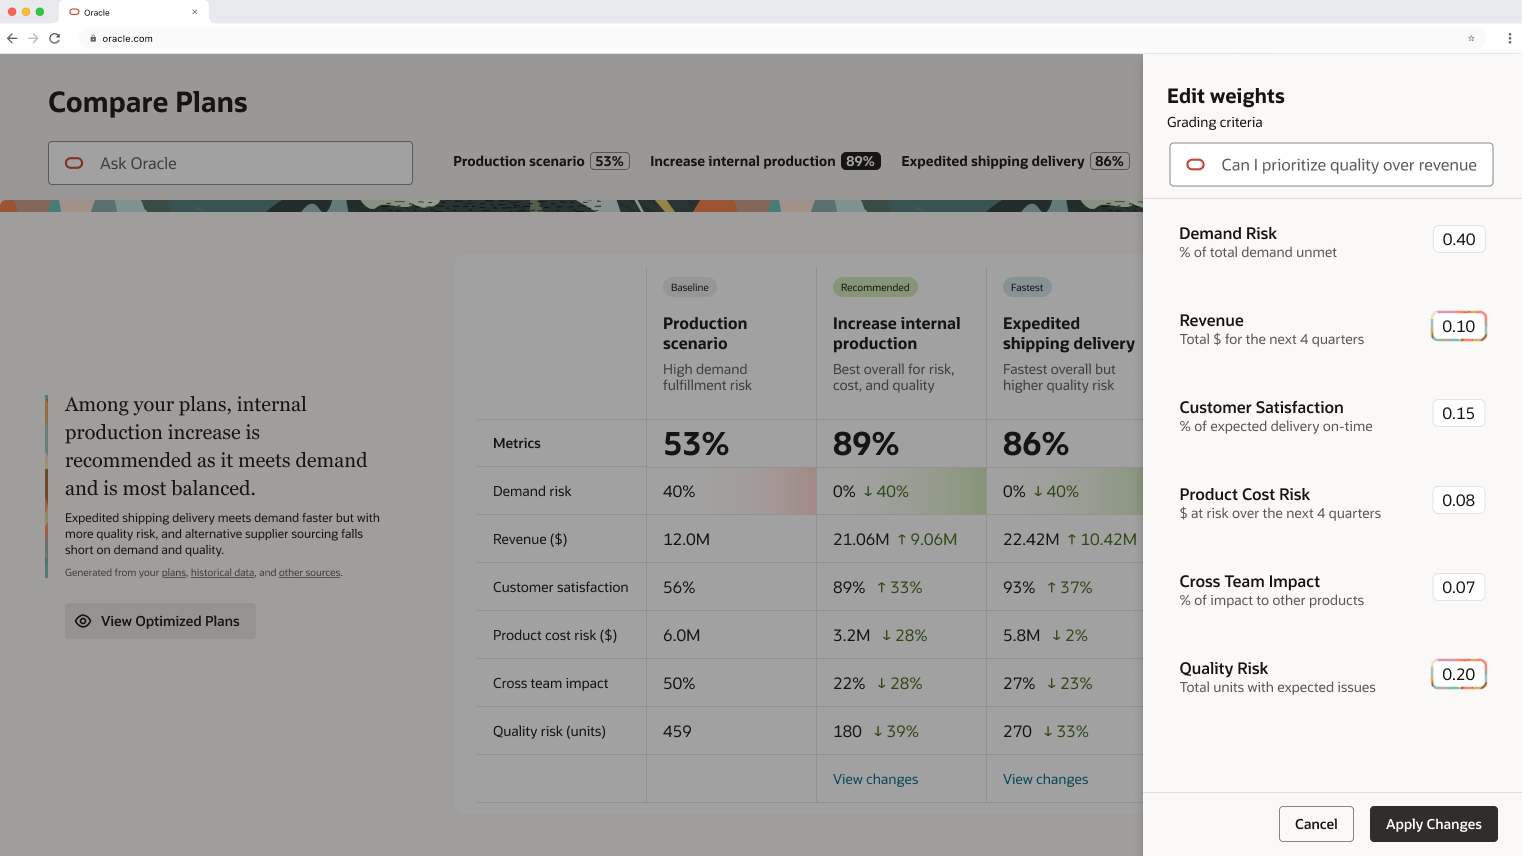
Customizable Prioritization
Amy notices that quality risk is weighted lowest, but given her new supplier situation, she actually wants to prioritize it.
Using Ask Oracle, she adjusts the weights through natural language. The system suggests new values, she applies them, and the grading updates accordingly.
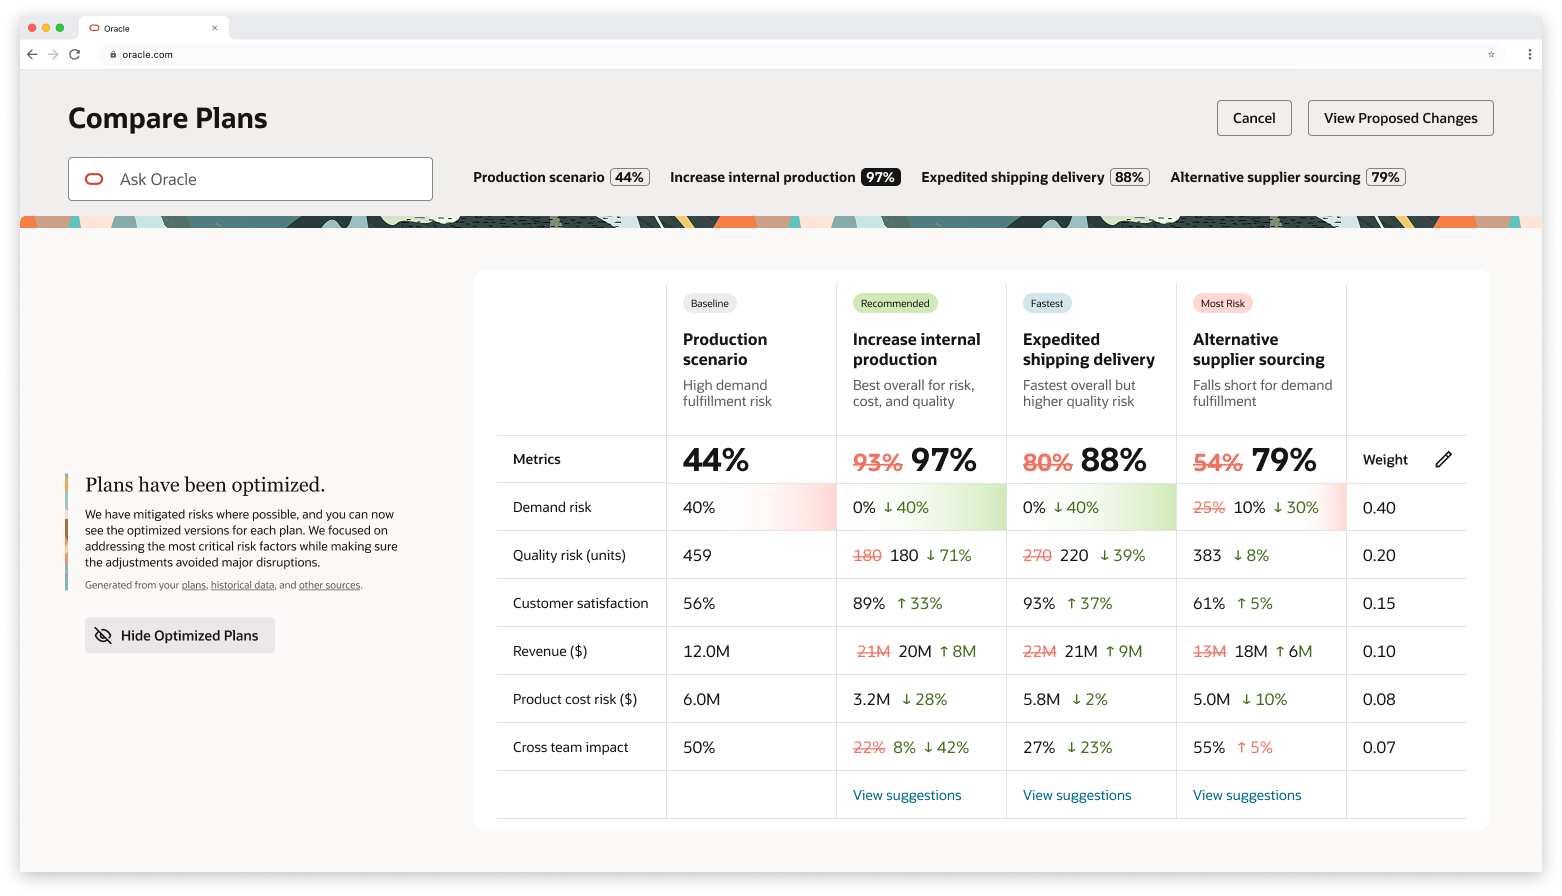
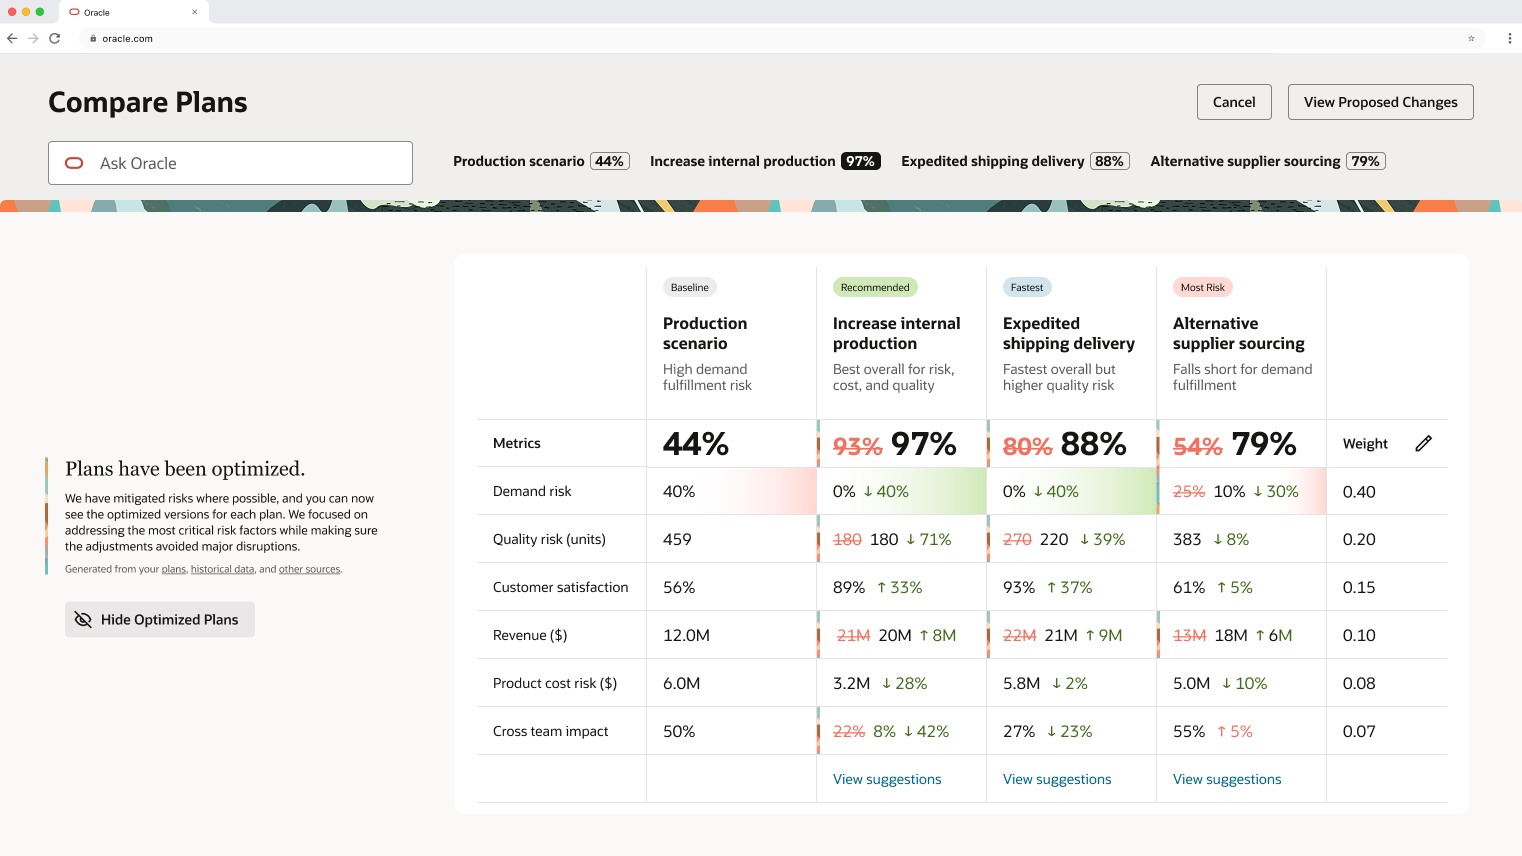
AI-Powered Optimization Preview
Amy wants to see what Compare can optimize. She previews the optimization, and Compare strengthens each plan within its unique constraints.
She sees inline strikethrough edits showing exactly what will change across all plans. Since each scenario takes a different approach, the optimizations vary per plan.
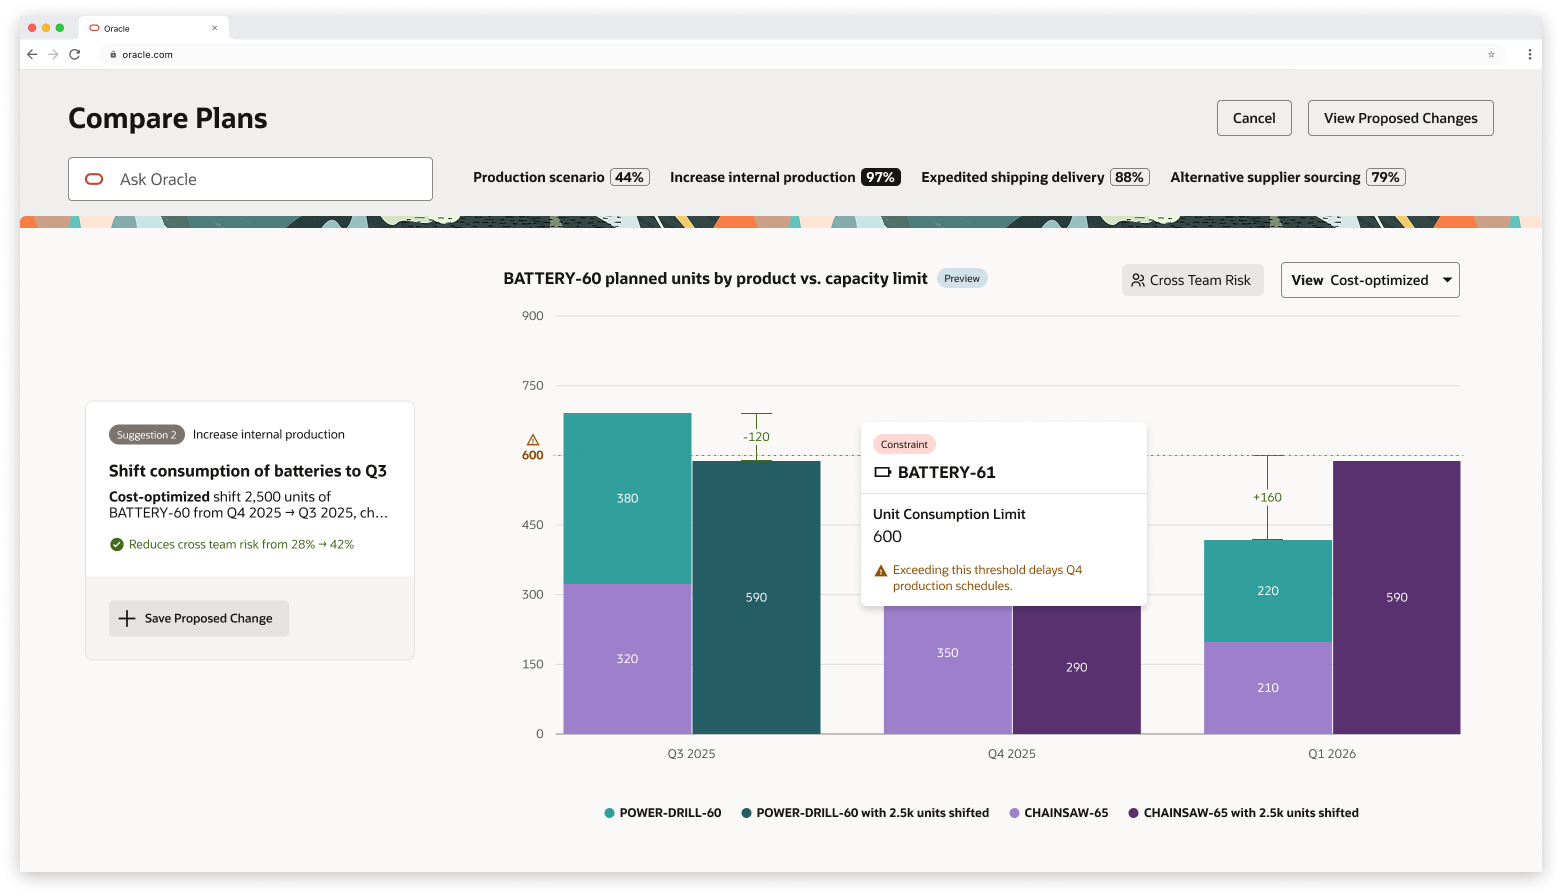
Interactive Refinement
Amy explores another suggestion and opens its preview. The visualizations are interactive - she hovers to see exactly what constraints are at play.
Compare has proactively anticipated the views Amy would want to see. She selects "most balanced" since that aligns with her priorities.
Then she tweaks it: her product POWER-DRILL needs more units in Q3. Since AI behaves like a colleague, it takes her feedback and adjusts the allocations.
Confident in this refined version, Amy saves the change.
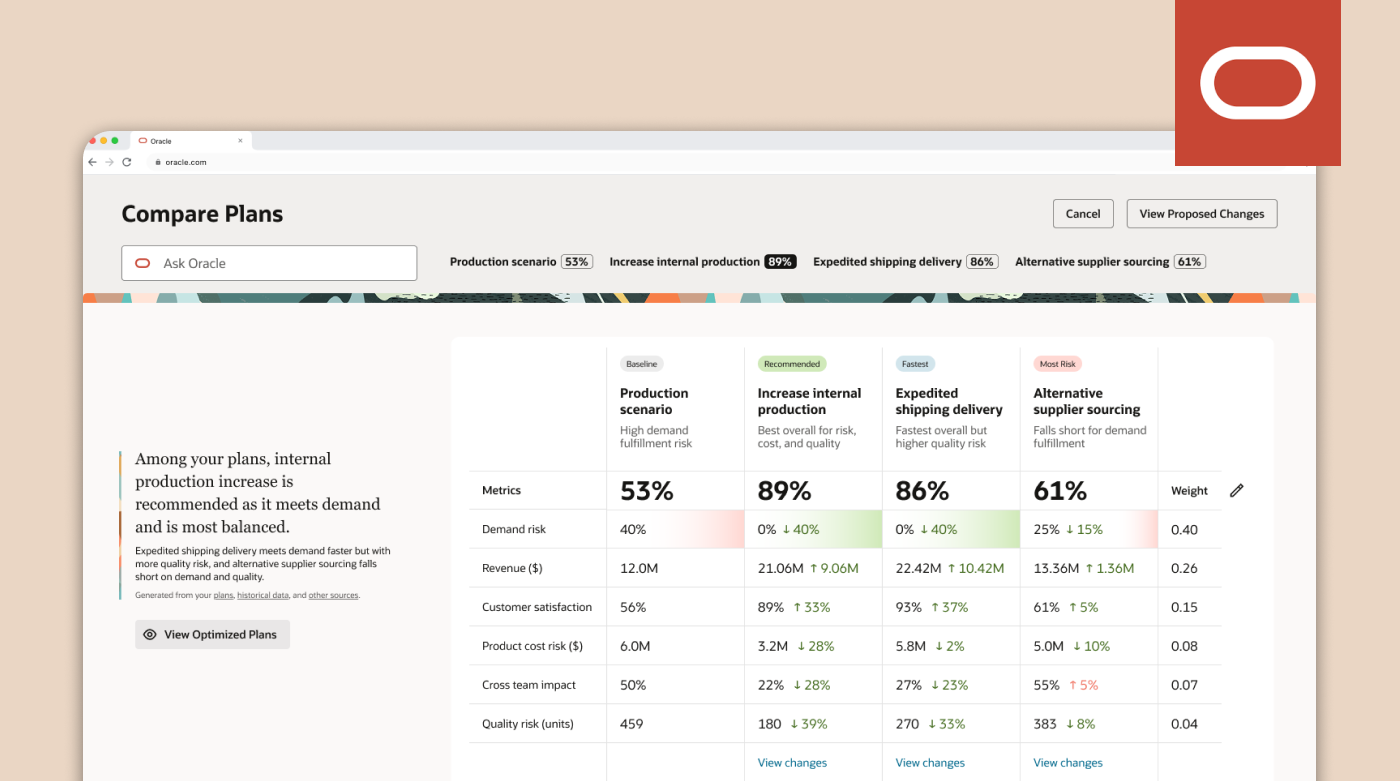
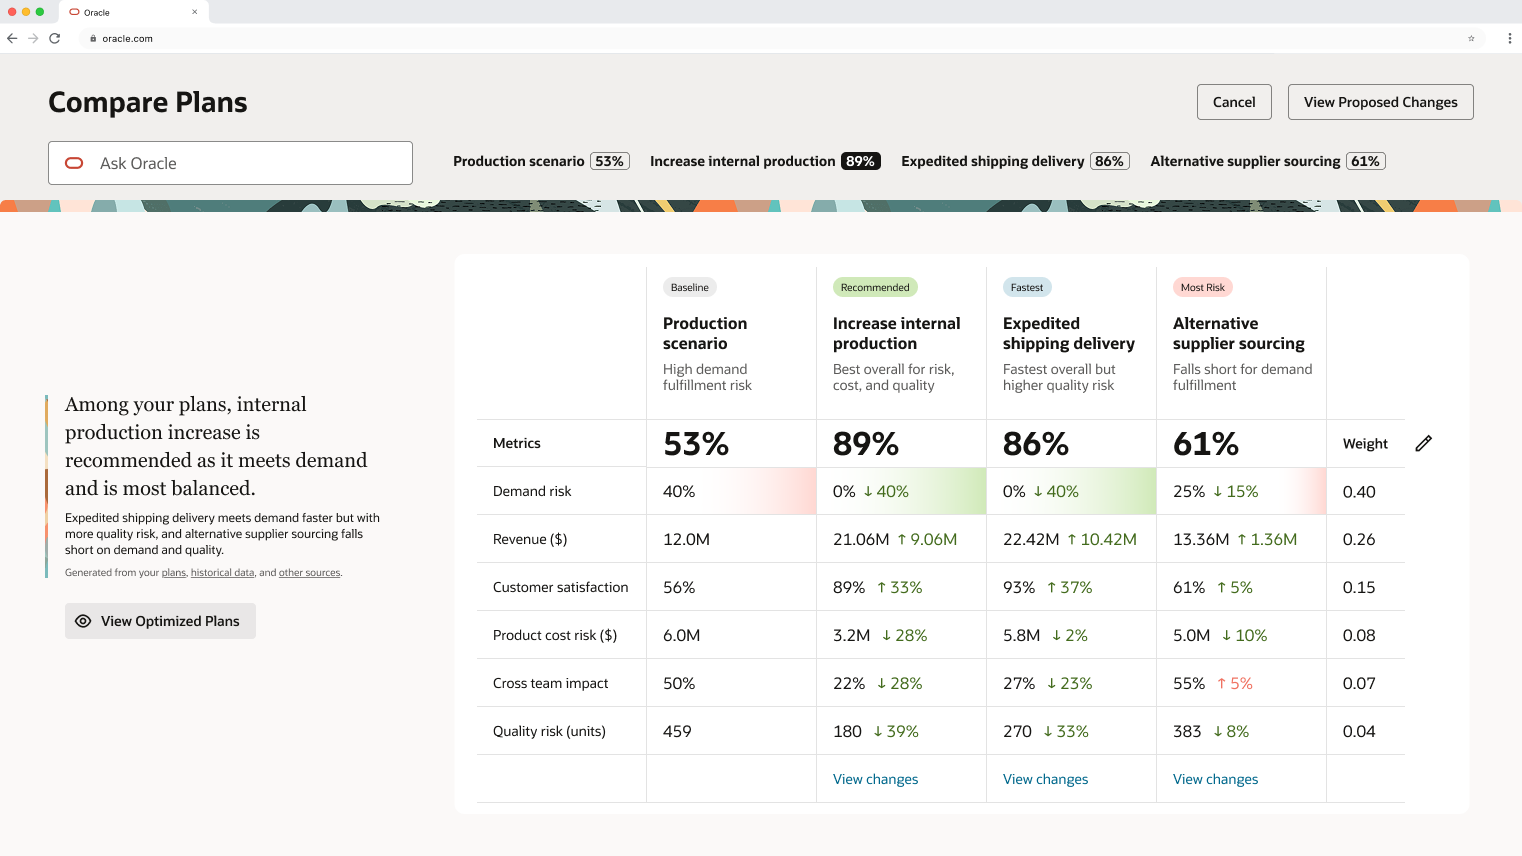
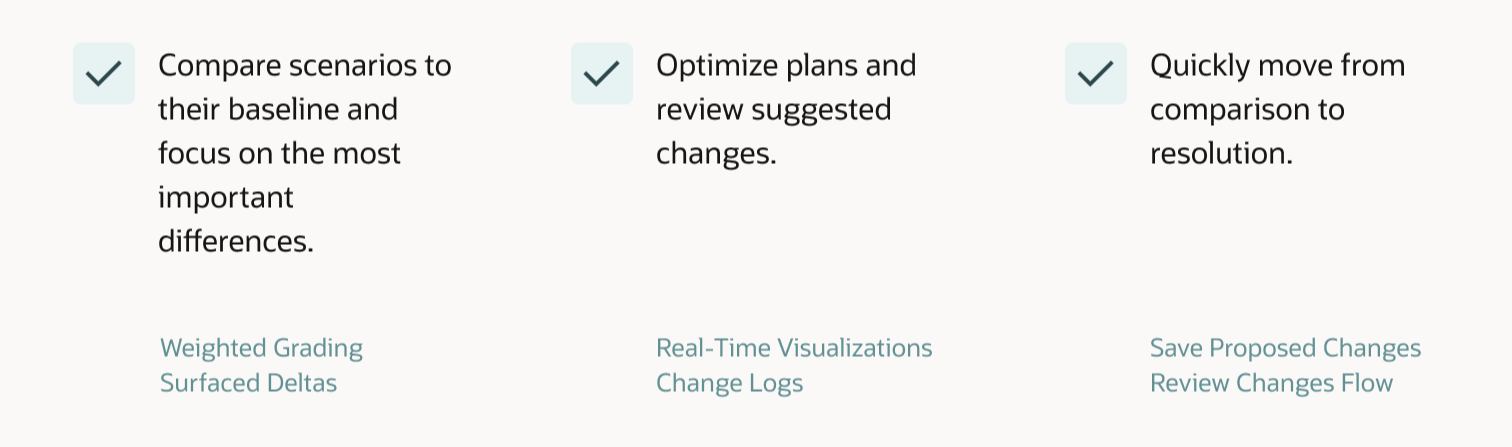
Intelligent Comparison Landing
Amy opens Compare and sees all her plans side-by-side: her baseline, her recommended plan, her fastest plan, and her at-most-risk plan.
What she sees:
Grades for each scenario
Short descriptions of each approach
Deltas: the key differences
Demand risk highlighted automatically as the most critical difference
Through this screen, Amy can immediately focus on what matters most.
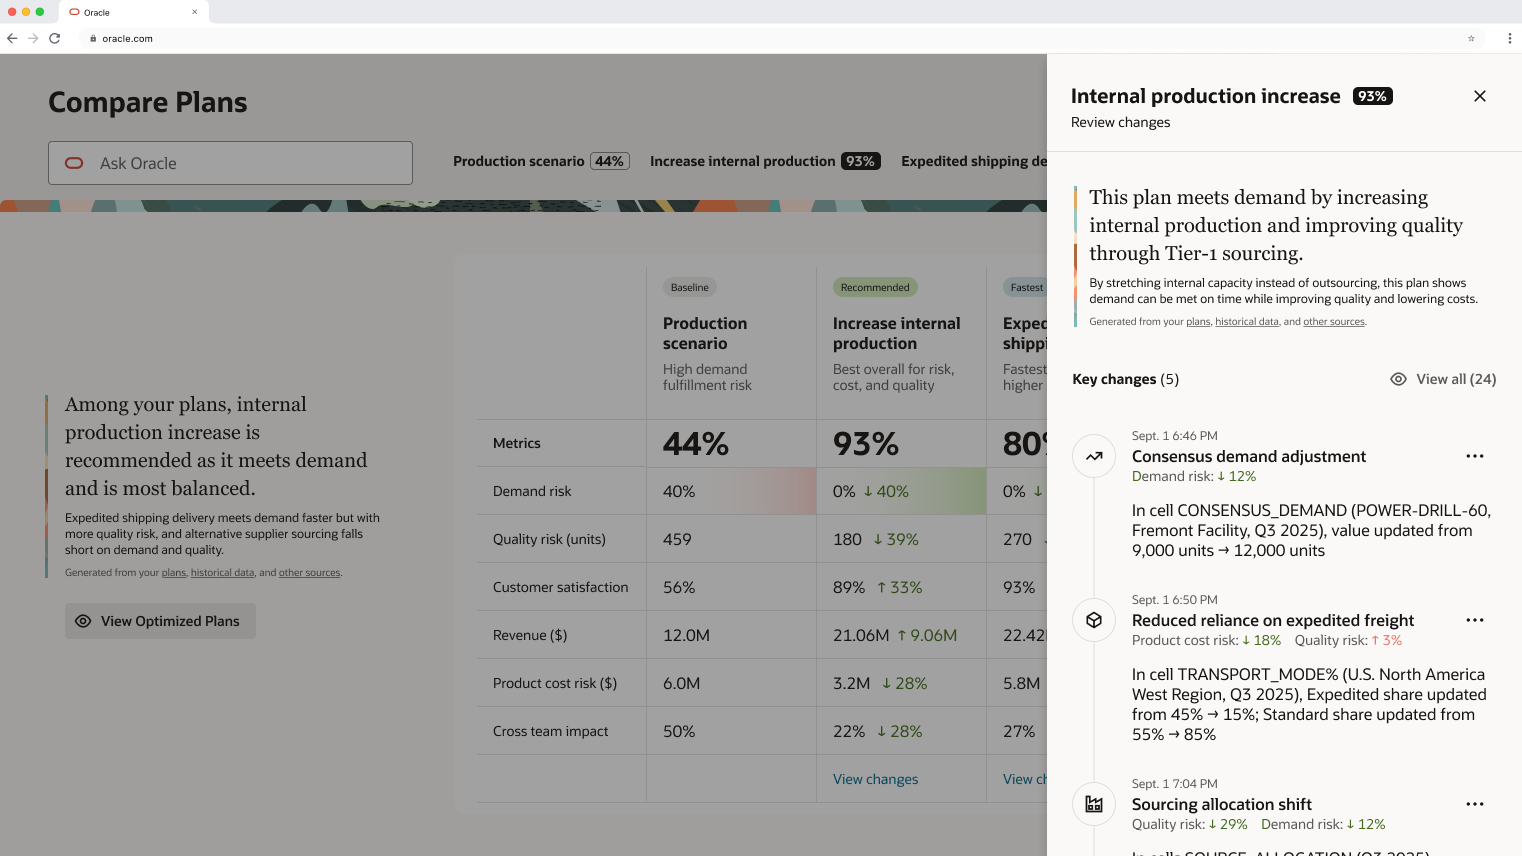
Change Transparency
Before moving forward, Amy wants to remember what changes she made to her plans last night.
She selects View Changes and gets:
A concise summary of changes for each plan against the baseline
Key modifications and their impact on the overall plan
This builds trust - she always knows what changed and why.
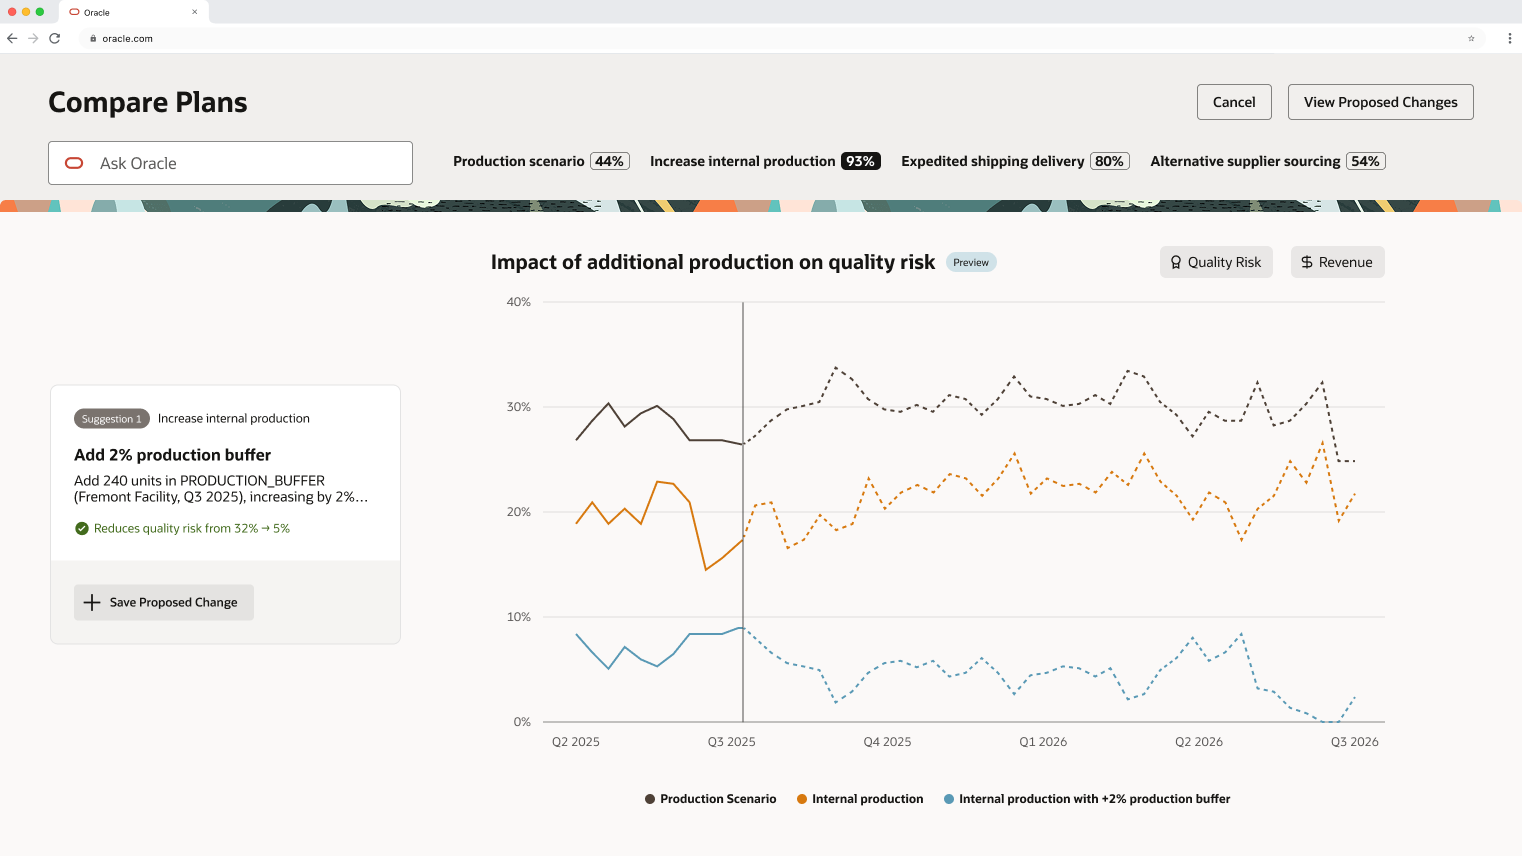
Guided Decision-Making with Visual Impact
Amy explores a suggestion: "Increase internal production."
She clicks to preview the change, and Compare:
Loads a new page with the exact visualization she needs
Shows real numbers demonstrating impact
Pulls from the template library - no time wasted building charts from scratch
With this context, Amy saves the proposed change.
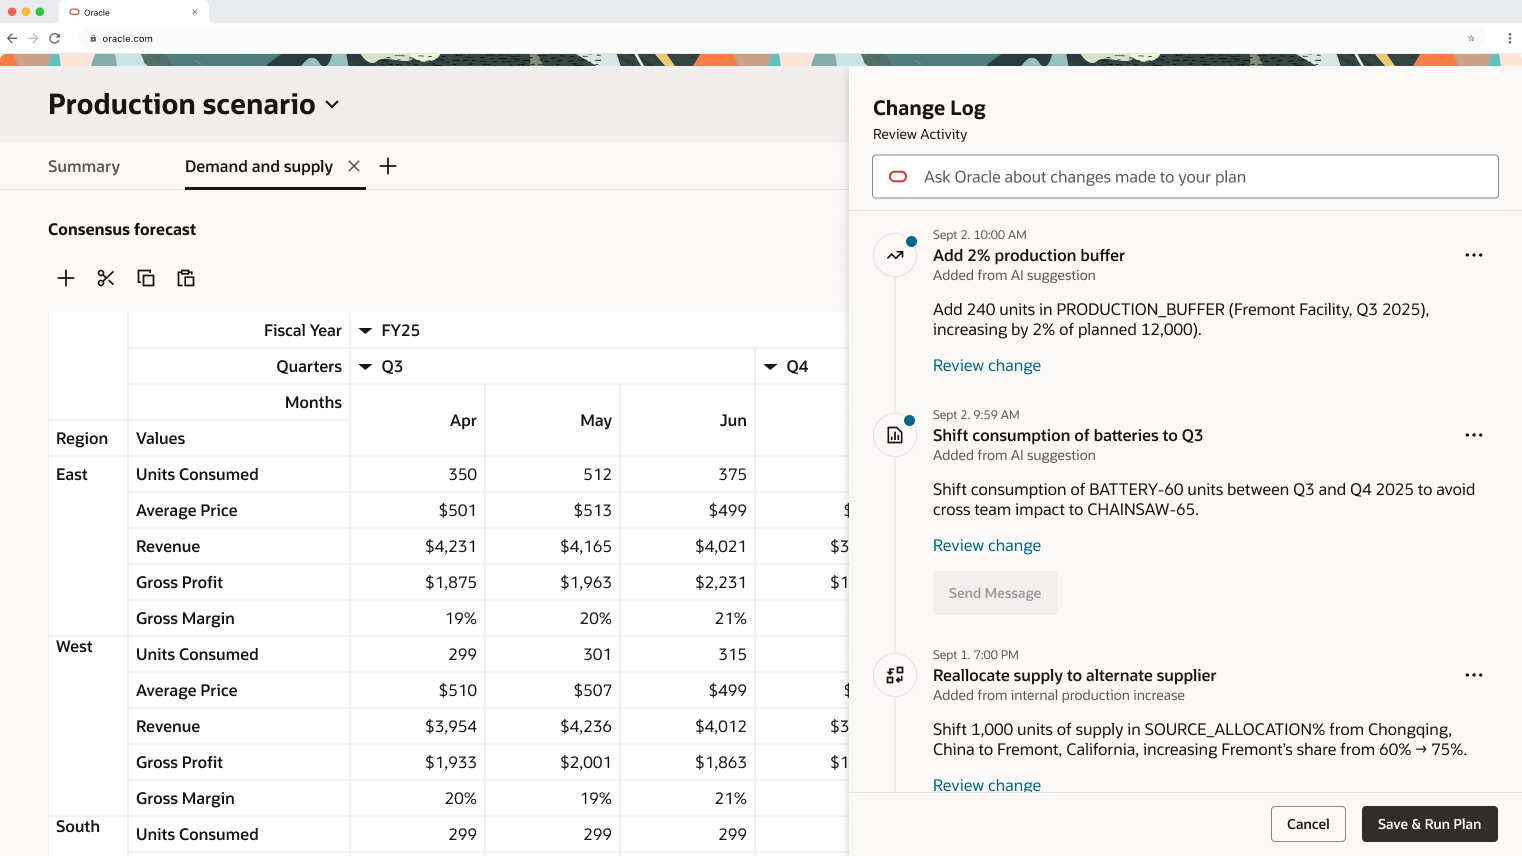
Applying Changes & Communication
Amy applies her saved changes. She's taken back to her baseline plan, Production Scenario, where she sees:
A change log of all modifications
The ability to click and view exactly what changed
An option to message her colleague who owns an impacted product, explaining the change
She sends the message, returns to Compare, and runs her updated plan. About 3 hours later, it's complete - she's addressed the urgent customer need.
Outcomes
Anchoring Mechanisms
I explored different approaches for helping users navigate insights and visualizations. With more time, I'd continue testing the best methods for bringing the right information to users at the right time.
Impact Calculations
I'd refine how improvements are quantified and communicated by collaborating more closely with planners to ensure the metrics truly reflect what matters to them.
AI Cues
A challenge I continue to think about: how do we signal to users that they can collaborate with AI? What visual or interaction patterns make this feel natural rather than surprising?
Areas for Further Development
1. Keep It Simple
Especially in complex problem spaces, I had to challenge myself to focus on what truly matters for users. I'm still improving in this area - it's easy to get caught up in feature ideas, but harder to ruthlessly prioritize.
2. Things Don't Always Go to Plan
The design I thought I'd landed on often changed. Flows I liked needed iteration. And that's part of the process. Staying flexible and open to feedback made the final solution stronger.
3. Always Return to the North Star
Every iteration, I asked: Does this serve the user goals and my design principles? This helped me stay grounded when navigating competing feedback and priorities.
Key Learnings
Special Thanks
Chris, Jason, Claudia, Peter, and the entire SCM Design Team for their mentorship, feedback, and support throughout this project.